
Any work involving data has a presentation and visualization component that is perhaps underappreciated.
The data you have in JavaScript graphs can be complicated to communicate. That raises the danger of unintentionally producing false graphs.

Today, more than ever before, a JavaScript chart can be exploited to manipulate data and spin stories. Particularly considering how quickly some of these themes propagate over social media.
All it takes to propagate a false narrative around the globe is one graph from an unreliable source sent out to a list of followers worldwide. So, in this post, we will help you spot these misleading graphs when they crop up.
In What Ways Do JavaScript Graphs Mislead You?
These days, manipulating JavaScript charts has become very common. Therefore, we will review the main methods developers employ to mislead their audience.
Omitting The Baseline
Removing or intentionally omitting the axis of a graph is perhaps the most common way of graph manipulation.
Unfortunately, this tactic can become misleading and is frequently used to manipulate results and make one group look better.
This tactic is known as a truncated graph in the data visualization world. These graphs tend to make something that is not very significant look like a massive difference.
In addition, writers tend to get into trouble when trying too hard to design a unique and creative graph.
So, the first thing they remove is the baselines or axis. This is due to the authors’ belief that it detracts readers from the data. However, it merely makes the data more difficult to interpret.
Manipulating The Y-Axis
Perhaps the most typical type of deceptive graph is one with a modified Y-axis.
For example, many people attempt to remove the zero from the Y-axis when comparing large numbers to one another to clearly illustrate the variations across occurrences.
This makes graphs very deceptive, as it minimizes the variations between instances. Therefore, knowing whether you are examining the relative or absolute differences between values is crucial.
Axis manipulation is considered the opposite of truncation, as it includes the axis and baselines but modifies them to the point where their meaning is lost.
It is a potent tool, especially on social media platforms, where it can be used to push a false narrative.
There could be many different ways to fix this problem. First, include the value of zero in your graph to start. It will display data without the Y-axis reading challenges. However, adding zero might be deceptive.
Therefore, it is recommended to include a zero-break and indicate that you have deleted zero from the graph in this situation. This demonstrates the data’s transparency and strengthens the validity of your conclusions.
Using Two Y-Axes
You might occasionally want to visualize two lines with separate Y-axes. However, when two events or variables appear to be connected but are not causally related, this is known as a spurious correlation.
You can quickly produce this effect in your graphs by matching the Y-axes of two different independent events.
A simple solution to stop graphs from being deceptive is to put zero into both Y-axes.
However, if your lines overlap without any real causal relationship, you could still discover a spurious correlation.
At this point, you should think about not displaying the graph at all.
However, when presenting such relationships, it is crucial that you can back them up with further data, experiments, test results, or analysis.
Misleading 3D JavaScript Graphs
Depending on their viewpoint, 3D graphs distort proportions and make objects appear larger or smaller. Furthermore, a 3D graph with the same number of axes is rarely more informative than a 2D graph with similar axes.
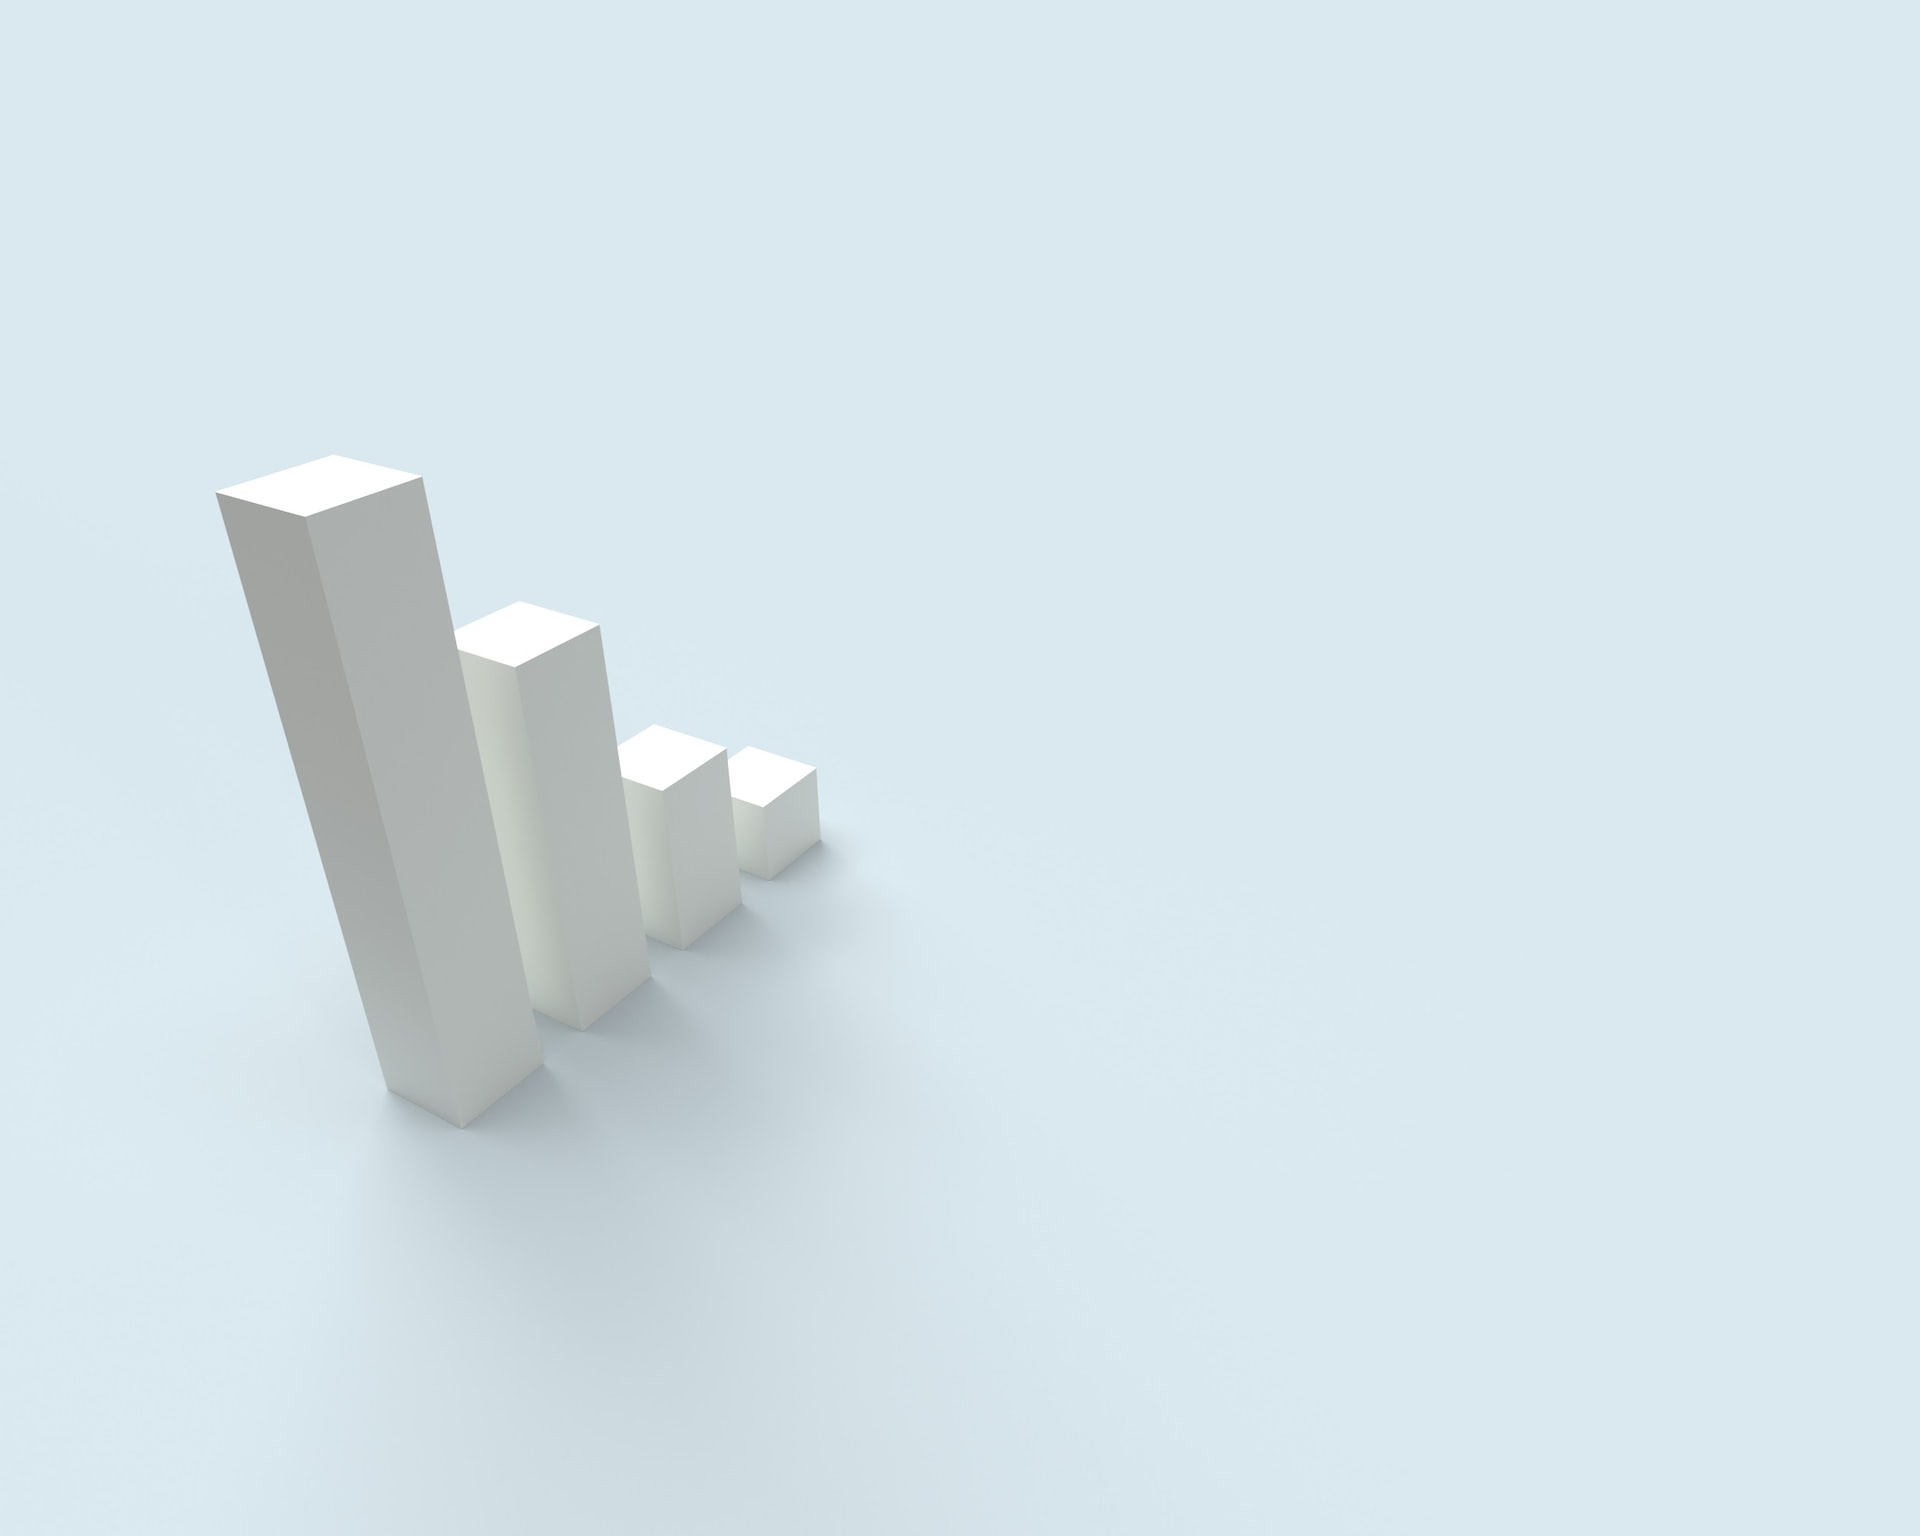
So, avoid using 3D graphs because they are prone to distortion and can mislead the reader.
Cherry Picking Data
Cherry picking is one of the most concerning strategies for producing deceptive charts. This refers to carefully selecting evidence that supports your point of view while ignoring material that does not.
It can be easy to get into this trap when you expect specific results from data. But unfortunately, some people deliberately cherry-pick the data that best suits them.
To avoid this, you must ask yourself, “what data are you not seeing?”
Keeping an open mind while answering that question could help discern a misleading graph that only presents a single biased data perspective from a clear one.
Improper Scaling
Some people like to add graphics and pictograms to their charts to make them more visually appealing. While this can improve the graph, creating a false, misleading graph is seriously risky.
The problem with pictograms is their relative sizes. For example, assume you have two values, 100 and 300, and you wish to represent them using pictograms as bars. If you scale the graphs uniformly, they offer a perceptually misleading comparison.
People typically perceive the area of the pictogram rather than its height, making them convey a false narrative.
The solution is relatively simple. Instead of making people focus on the pictogram area, have them focus on the height. This can be accomplished by stacking the pictograms rather than shrinking the area.
Choice of JavaScript Graphs to Represent Data
So far, we’ve discussed how writers employ deliberate disinformation to further their narrative.
Now, let us consider the various sorts of misinformation that might result from incompetence.

This usually entails selecting a graph or chart that does not correspond to the data you are attempting to display. One example is the misunderstanding of the pie chart.
It is not the fault of the pie chart that it may be so deceptive; it is the fault of those who believe it can be utilized for any sort of data.
Therefore, when selecting a graph, it is essential to ask yourself, “What kind of graph would be best to convey the information?” So be it for relative comparisons, trends, or absolute comparisons.
Going Against Conventions
The last thing people use to mislead visualizations is altering long-held conventions or associations.
If you’re unsure what I’m talking about, imagine a graph where red represents Democrats and blue represents Republicans. It would be chaos!
Another example would be to use red for profits and green for losses in a stock market graph.
So, going against conventions is a tool to manipulate an audience and can be easily prevented by looking at the graph with a little more care.
Do You Know All About Misleading JavaScript Graphs?
Deceptive graphs can be intentionally misleading and might result in somebody not comprehending the data underlying the graph they make. Cases of “classic” misleading graphs include those in which:
-
- The vertical scale is either too large or too small, skips digits, or does not begin at zero
- The graph is not correctly labeled
- Data is missing
However, some real-life misleading graphs go beyond the standard types. Some are meant to deceive, while others are intended to shock. In some circumstances, well-meaning individuals simply got it all wrong.
Misleading graphs are a terrible warning, and you must know how to recognize them. This article has gone over everything you need to know about them.
You should check where the graph comes from and then look closely at the data, reflecting on all the points.
Most people sharing misleading graphs do not have your best interests in mind, so be careful and do your research.