
Measure brand awareness with a mixed scorecard: survey memory, search demand, share of voice, direct traffic, social mentions, and sales context. No single metric can prove that people know your brand. The reliable answer comes from tracking several signals over time, then linking them to media activity, market events, and business outcomes.
TLDR: Brand awareness measurement works best when you combine research data with behavioral analytics. For example, a B2B software company might see aided awareness rise from 32% to 41% after a 10-week campaign, while branded search grows 18% and direct traffic rises 12%. That is a stronger signal than any one number alone. Report awareness as a trend, not as a one-off victory slide.
What brand awareness really means
Brand awareness is the degree to which a target audience recognizes, recalls, and correctly associates your brand with a category, product, or need. It is not just “have people heard of us?” A person may recognize your logo but have no idea what you sell. Another person may search your brand name because a colleague recommended you last week.
A serious measurement program splits awareness into levels:
- Unaided awareness: People name your brand without prompts.
- Aided awareness: People recognize your brand from a list.
- Brand recall by category: People connect your brand to a product need.
- Brand recognition: People identify your name, logo, packaging, or advertising.
- Brand salience: People think of you at the right buying moment.
This distinction matters. A brand can have high recognition and weak salience. That means people know it exists but do not think of it when they need to buy. That is annoying, expensive, and common.
Image not found in postmetaCore metrics to track
1. Unaided brand awareness
Ask respondents an open question: “When you think of project management software, which brands come to mind?” The percentage who name your brand is your unaided awareness. This is one of the most useful measures because it reflects mental availability without prompting.
2. Aided brand awareness
Show a list of brands and ask which ones respondents know. This usually produces higher scores than unaided awareness. Use it to understand recognition, but do not treat it as proof of preference.
3. Branded search volume
Track how often people search for your company name, product names, and common misspellings. Use tools such as Google Search Console, Google Trends, SEO platforms, and paid search reports. Rising branded search often indicates growing market interest.
4. Direct traffic
Direct traffic can show that people know your URL or have your site saved. But be careful. Analytics tools often dump unattributed visits into “direct.” Honestly, it feels like half the job is cleaning up messy tracking before anyone can trust the chart.
5. Share of voice
Share of voice compares your visibility with competitors across paid media, organic search, press, social media, podcasts, or review sites. For example, if your brand receives 800 relevant mentions in a month and five competitors receive 3,200 combined, your share of voice is 20%.
6. Social and community mentions
Count brand mentions, tags, sentiment, and discussion quality. Do not stop at volume. Ten detailed LinkedIn posts from target buyers may matter more than 2,000 low-quality comments from the wrong audience.
7. Referral and word-of-mouth indicators
Ask new customers how they first heard about you. Include choices such as colleague, podcast, analyst report, event, search, social media, and advertising. Free-text answers are useful because people often describe the real path better than dropdowns do.
Research methods that produce cleaner answers
Brand tracking surveys are the foundation. Run them quarterly, monthly, or after major campaigns. Use a consistent sample that matches your target market. If you sell HR software to companies with 500+ employees, do not survey random consumers and call it insight.
A useful survey should include:
- Unaided awareness questions
- Aided awareness questions
- Category association questions
- Message recall questions
- Consideration and preference questions
- Basic demographic or firmographic filters
Pre and post campaign studies compare awareness before and after a campaign. This works best when you define the exposed audience, control group, and time period. If awareness rises from 24% to 31%, ask what else happened. Did competitors cut spend? Did a news story mention you? Did your sales team run a large outbound push?
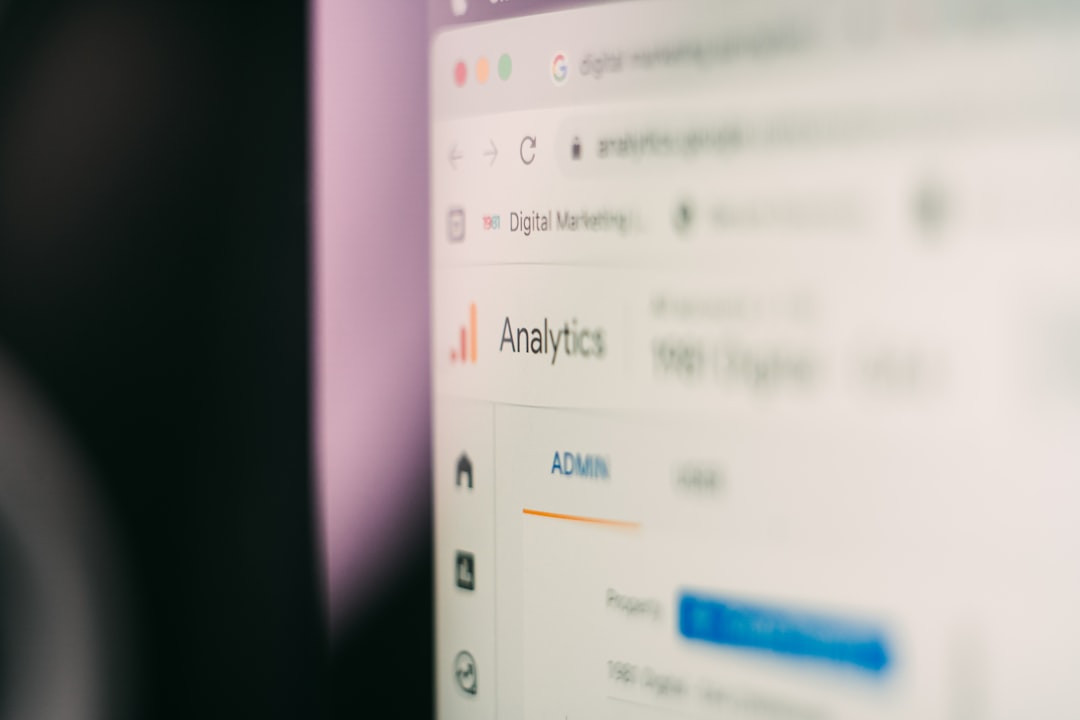
Search and web analytics provide behavioral evidence. They are not perfect, but they add weight. Look at branded impressions, branded clicks, direct sessions, returning users, homepage visits, and product page visits. Expect to waste time on bot filters, consent gaps, and tracking changes after site releases. A tag firing three seconds late can distort more than people think.
Social listening and media monitoring help you see public visibility. Track both volume and context. Separate press coverage, influencer posts, customer comments, employee advocacy, and complaints. A spike in mentions is not always good news.
How to build a practical reporting framework
A strong report starts with the business question. Do not open with twenty charts. Start with the answer: “Awareness among enterprise buyers improved, but category association remains weak.” Then show the proof.
Use a simple reporting structure:
- Executive summary: Three to five findings that matter.
- Awareness scorecard: Unaided, aided, search, direct traffic, and share of voice.
- Audience breakdown: Segment by market, buyer role, age, region, or company size.
- Competitive view: Compare your trend with key competitors.
- Drivers: Connect changes to campaigns, PR, events, SEO, partnerships, or product news.
- Business link: Show any relationship with pipeline, conversion rate, or customer acquisition cost.
- Actions: State what should change next month or next quarter.
Keep the scorecard stable. Changing definitions every month destroys trust. If “brand mention” includes press in January but excludes press in February, the trend is almost useless.
A simple example
Assume a regional bank runs a six-week campaign to promote small business lending. Before the campaign, unaided awareness among small business owners is 18%. Aided awareness is 46%. Branded search averages 9,500 monthly searches. Direct traffic to the lending page averages 4,200 visits per month.
After the campaign, a matched survey shows unaided awareness at 23% and aided awareness at 52%. Branded search rises to 11,300 searches, up 19%. Direct visits to the lending page increase to 5,000, up 19%. Loan inquiry forms rise 8%.
This does not prove the campaign caused every lift. Still, the pattern is credible. Survey memory improved. Search demand moved. Site behavior followed. Commercial action increased. That is a useful awareness story.

Common mistakes to avoid
- Reporting impressions as awareness. Impressions show delivery, not memory.
- Using only social followers. Followers may not be buyers, and many never see your posts.
- Ignoring negative awareness. People may know you for the wrong reason.
- Surveying the wrong audience. Bad sampling gives neat charts and poor decisions.
- Claiming causation too quickly. Awareness moves for many reasons.
How often should you measure?
Large brands often run continuous tracking. Smaller companies can usually start with quarterly surveys and monthly analytics reviews. Campaign-specific studies should include a baseline before launch and a follow-up soon after the main media period ends. For long sales cycles, add another read several months later.
The best cadence depends on spend, market size, and decision speed. If your media budget is small, weekly awareness reporting may create noise. If you operate in several countries with heavy spend, quarterly reads may be too slow.
Final recommendation
Treat brand awareness as a serious business measure, not a vanity metric. Use surveys to measure memory. Use analytics to measure revealed interest. Use competitor data to add context. Then report the trend in plain language that a finance team, sales leader, and chief executive can understand.
The strongest framework is simple: who knows you, what they associate with you, how that is changing, and whether those changes support business growth.